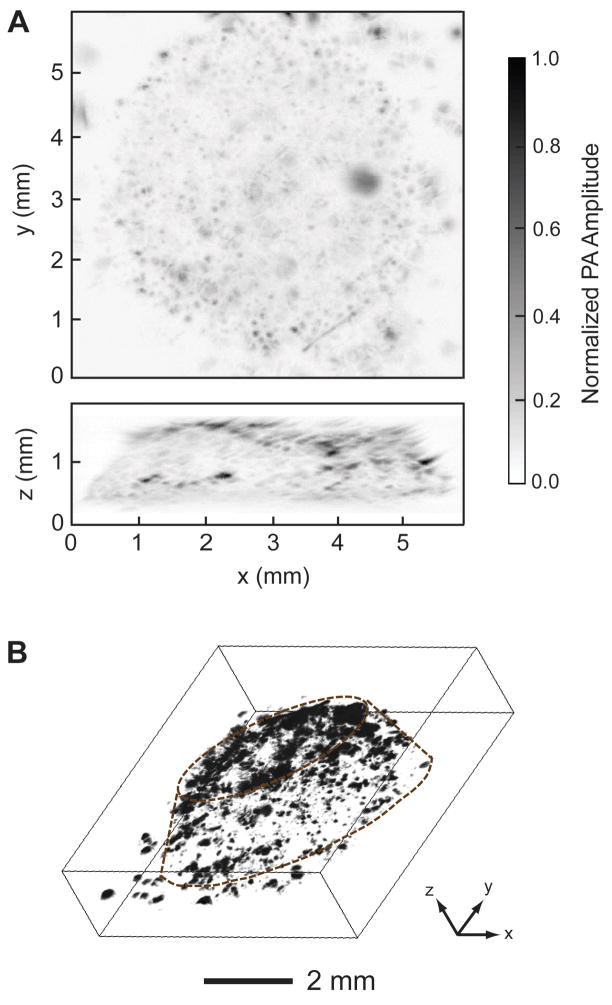
Fig. 4.
PA images of melanoma cells in a scaffold acquired at 14 days post-seeding. A) PA coronal (top) and sagittal (side) MAP images. The black dots correspond to melanoma cells. B) 3D depiction of the PA image, where the contour of the scaffold is marked by dotted lines. MAP: maximum amplitude projection.

