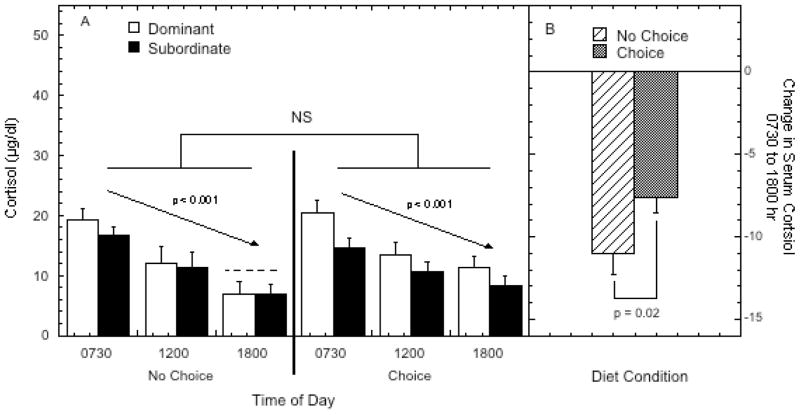
Figure 3.
Panel A shows mean ± SEM serum diurnal cortisol (μg/dl) concentrations at 0730, 1200, 1800 hours during week two of each diet phase for dominant (open bars) and subordinate females (closed bars). The dashed line above the bars for the 1800 hr time point for the no choice condition illustrates the mean of serum cortisol for the 1800 hr time point for the choice condition. Panel B shows the change in serum cortisol from 0730 to 1800 hr for both diet conditions, collapsed across dominance status. “NS” indicates the indicated comparison was not significant (p > 0.05).

