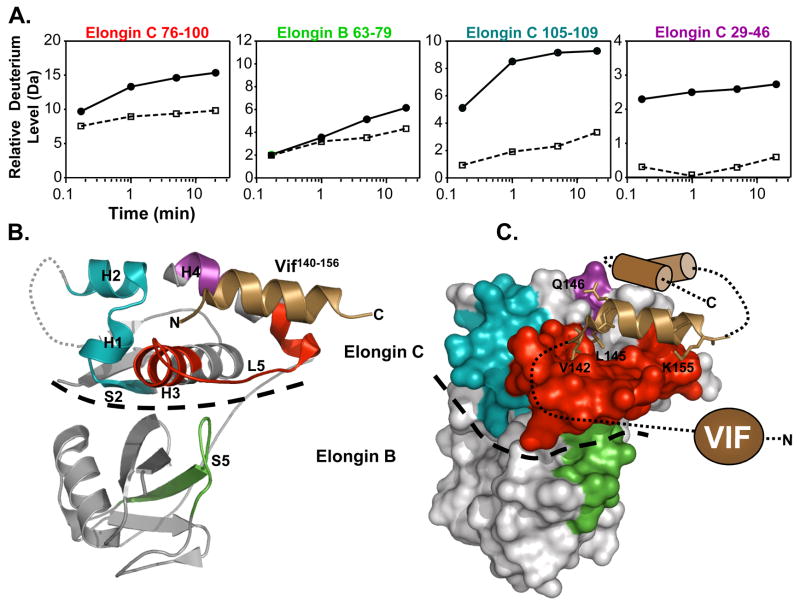
Figure 5.
Location of conformational changes in Elongin B and C induced by HIV-1 Vif interaction. (A) Deuterium uptake curves for Elongin C and B peptic peptides that displayed changes in deuterium uptake upon interaction with Vif (all peptide data can be found in Figure S4). The solid lines represent the Elongin BC complex alone and the dotted lines represent the Elongin BC complex bound to Vif. The error for determination of the deuterium level was ±0.25Da. (B) The location of the changes mapped onto the ribbon diagram of the structure of the Vif140–156 :Elongin BC complex (PDB:3DCG) 12 and (C) onto a surface representation. The colors in panel A correspond to the colors in panels B,C (i.e. Elongin C 76–100, red; Elongin B 63–79, green; Elongin C 105–109, blue; Elongin C 29–46, purple). The grey sections indicate regions where there were no changes in deuterium uptake or the deuterium incorporation could not be monitored. The HIV-1 Vif peptide 140–156 is represented as the copper helix and the remaining structurally uncharacterized regions of Vif are depicted in cartoon form. A dotted line indicates the boundary between Elongin C and Elongin B.

