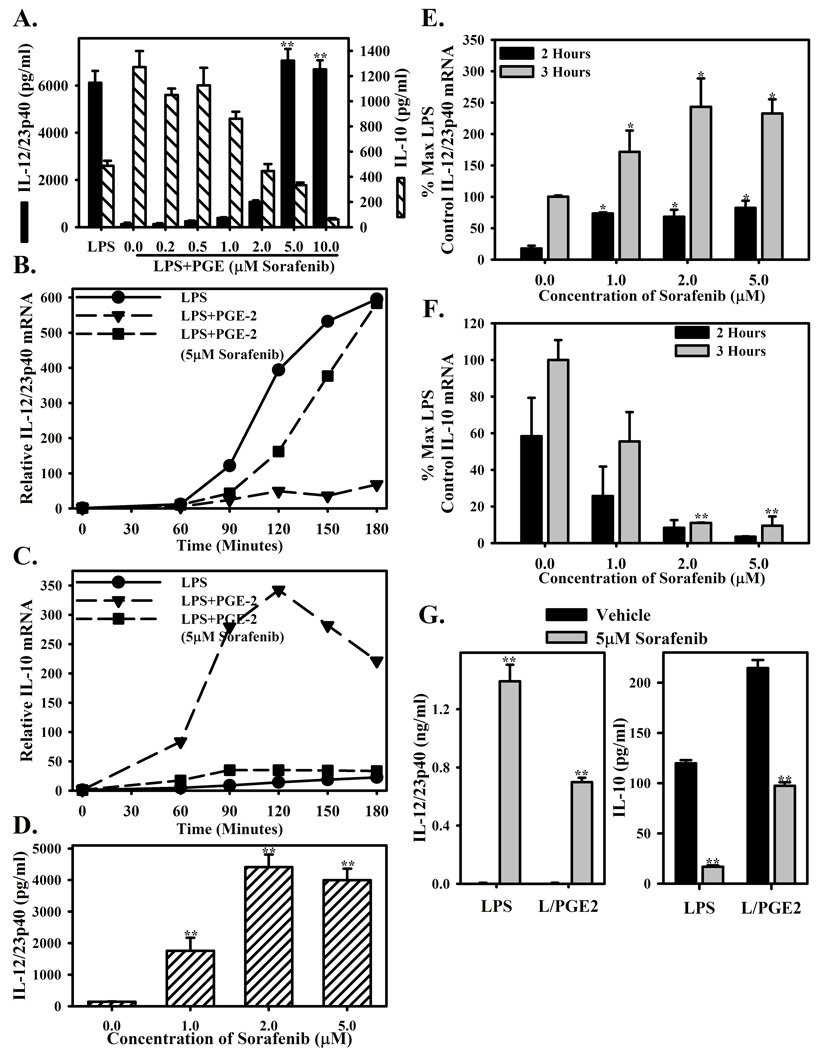
Figure 1. Sorafenib reverses PGE2 mediated suppression of LPS induced IL-12 expression.
(A.) Bone marrow-derived macrophages were pre-treated for 1 hour with increasing concentrations (0.2–10µM) of Sorafenib or vehicle control (DMSO, 0µM), then stimulated with LPS (10ng/ml) with PGE2 (10−8M). 16 hour culture supernatants were measured for IL-12p40 (black bars) or IL-10 (hatched bars) by ELISA. LPS stimulation alone is present as a control. (B.,C.) BMMΦ were pre-treated and stimulated as in (A). The presence of IL-12/23p40 (B.) and IL-10 (C.) mRNA was measured at 0’, 60’, 90’, 120’, 150’, and 180’ post-stimulation by real-time PCR after stimulation with LPS (circles), LPS+PGE (triangles), or LPS+PGE in the presence of Sorafenib (5µM, squares). mRNA levels are presented as relative to the expression at 0’. (D.) BMMΦ were pre-treated with vehicle or 1–5µM Sorafenib then stimulated with LPS alone. IL-12/23p40 protein was measured by ELISA. Culture supernatants were diluted 1:50 prior to ELISA. (E., F.) BMMΦ were pretreated and simulated as in (D.), and then IL-12/23p40 and IL-10 expression was measured by real-time PCR 2 and 3 hours after stimulation. (G.) Peritoneal macrophages were pretreated with vehicle or 5µM Sorafenib as in (A) and stimulated with LPS or LPS+ PGE2. ELISAs were performed from 16h culture supernatants. Each bar represents the mean ± SD triplicate samples. *Indicates a p-value <0.05 and **indicates a p-value <0.01 as determined by student’s T-test comparing drug to vehicle control. Figures are representative of three independent experiments.

