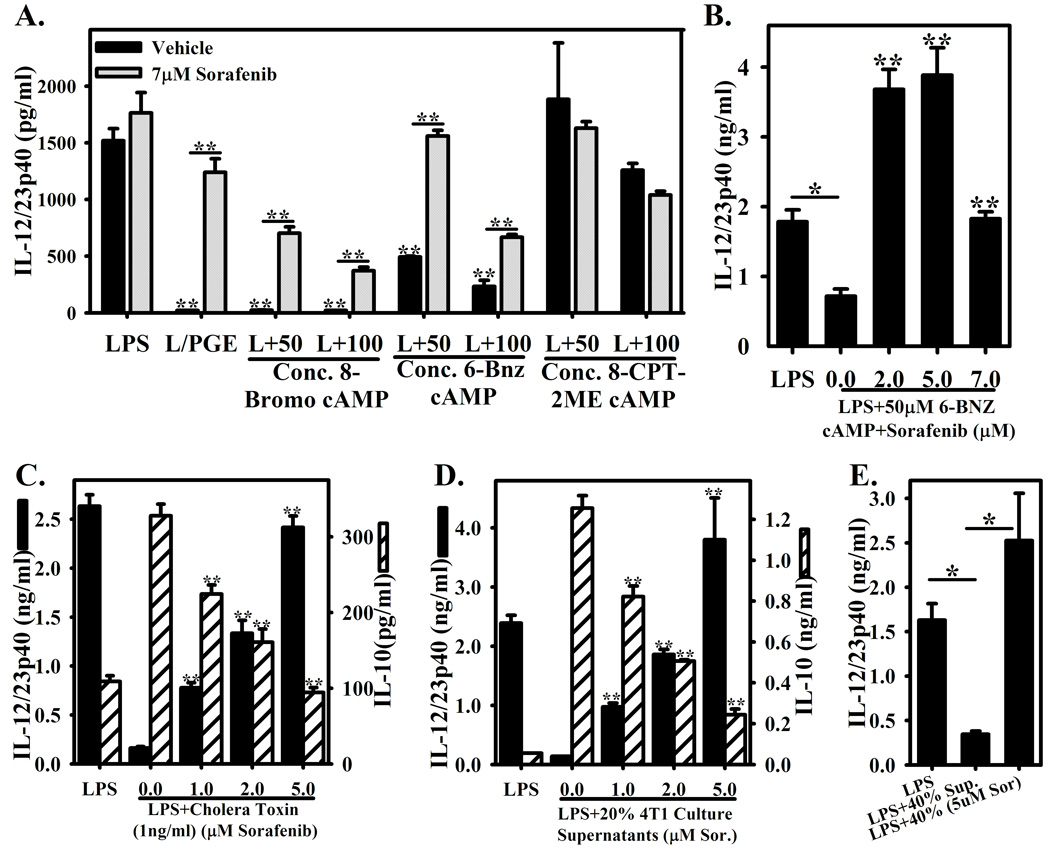
Figure 2. Sorafenib reverses tumor culture supernatant and cAMP analogue and tumor culture supernatant mediated suppression of IL-12 expression.
(A.) BMMΦ stimulated with LPS in the presence of cAMP analogs at 50–100µM. A general cAMP analog (8-Bromo cAMP), a PKA-activating analog (6-BNZ-cAMP), or an EPAC activating analog (8-CPT-2′-O-Me-cAMP) were used. Macrophages were either pretreated with vehicle (black bars) or 7µM Sorafenib (hatched bars). Concentrations of IL-12/23p40 were measured by ELISA. Stimulation with LPS alone and LPS+PGE are present as controls. (B.) Macrophages with stimulated with LPS+50µM 6-BNZ-cAMP in the presence of various doses of Sorafenib (2–7µM) or vehicle (0µM). Concentrations of IL-12/23p40 were measured by ELISA. LPS stimulation alone is present as a control. (C.) BMMΦ were stimulated with LPS or LPS+Cholera Toxin (1ng/ml) in the presence of increasing concentrations of Sorafenib (0–5µM). Concentrations of IL-12/23p40 and IL-10 are presented as in (A.). (D.–E.) 4T1 and NT2.5 mouse mammary tumor cells were cultured overnight at approximately 106 cells/ml of macrophage culture media overnight as a source of tumor culture supernatants. Media was collected and centrifuged, then added to BMMΦ cultures at final concentrations of 20% (D.) and 40% (E.). (D.) BMMΦ were stimulated with LPS or LPS+20% 4T1 culture supernatants in the presence or absence of increasing concentrations of Sorafenib (0–5µM). Concentrations of IL-12/23p40 (black bars) or IL-10 (hatched bars) were measured by ELISA. (E.) BMMΦ were stimulated with LPS or LPS+40% NT2.5 culture supernatants in the presence or absence of 5µM Sorafenib. Each bar represents the mean ± SD of triplicate samples. *Indicates a p-value <0.01 in (B.) and (E.). **Indicates a p-value <0.001, comparing drug to vehicle control in A., B., C., and D., as well as comparing LPS alone to LPS+PGE, LPS+8-Bromo cAMP, and LPS+6-Bnz cAMP in (A.). Figures are representative of three independent experiments.

