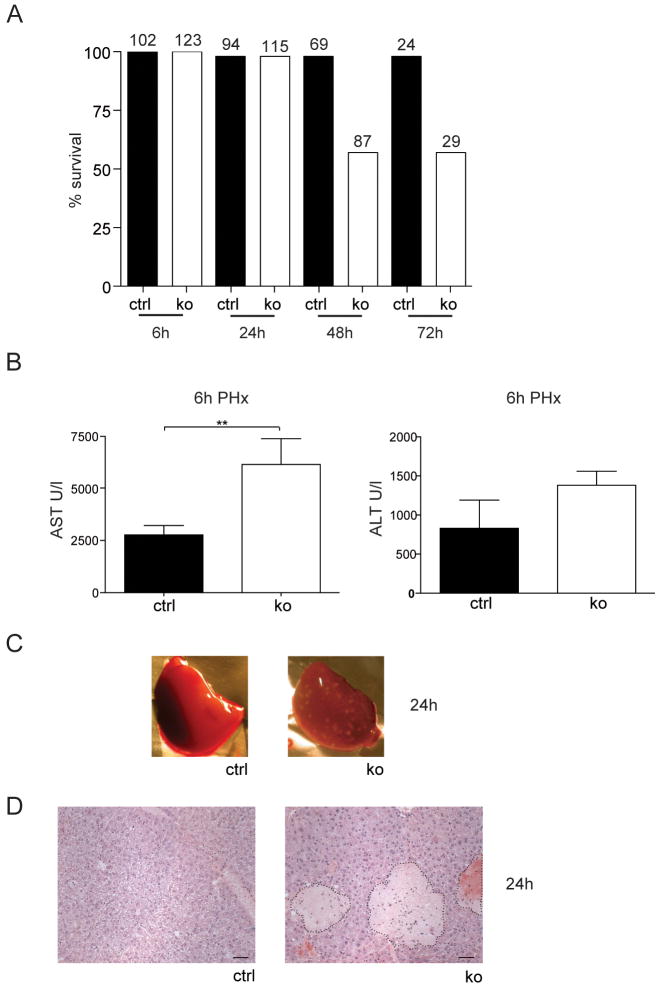
Fig. 3. FGFR1 and FGFR2 cooperate to enhance survival of mice and to prevent hepatocyte necrosis after PH.
Mice were subjected to PH. (A) The percentage of surviving animals at different time points after PH is indicated. Numbers above the bars indicate the number of animals observed at each time point per genotype. (B) AST and ALT levels in the serum were determined 6h after PH. N≥5 per genotype. (C,D) Macroscopic (C) and histological analysis (D) revealed the presence of necrotic lesions in the liver of Alb-R1/R2 mice 24h after PH (N≥12 per genotype). Bar: 50μm.

