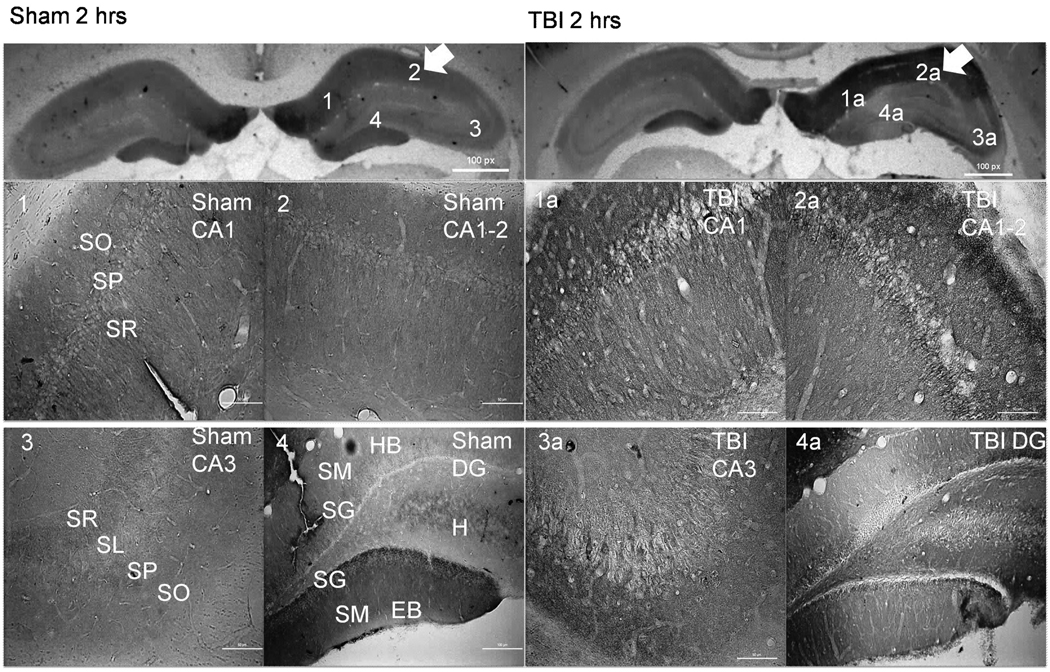
Figure 1.
CnB1 immunohistochemistry demonstrating alterations in CnB1 isoform distribution 2 hours following TBI (right panels). Arrows indicate side of cortex ipsilateral to injury or sham surgery. There is a noticeable increase of staining within CA1 and CA1-2 in TBI (1a and 2a) versus sham (1 and 2). There is a significant loss of CnB1 expression within the EB of the DG in TBI (4a) versus sham (4). Scale bars, 50 µm for regional sections. Abbreviations: SO= Stratum Oriens; SP= Stratum Pyramidale; SR= Stratum Radiatum; SL= Stratum Lucidum; SM= Stratum Moleculare; SG= Stratum Granulosum; HB= Hidden Blade; H=Hilus; EB= Exposed Blade.

