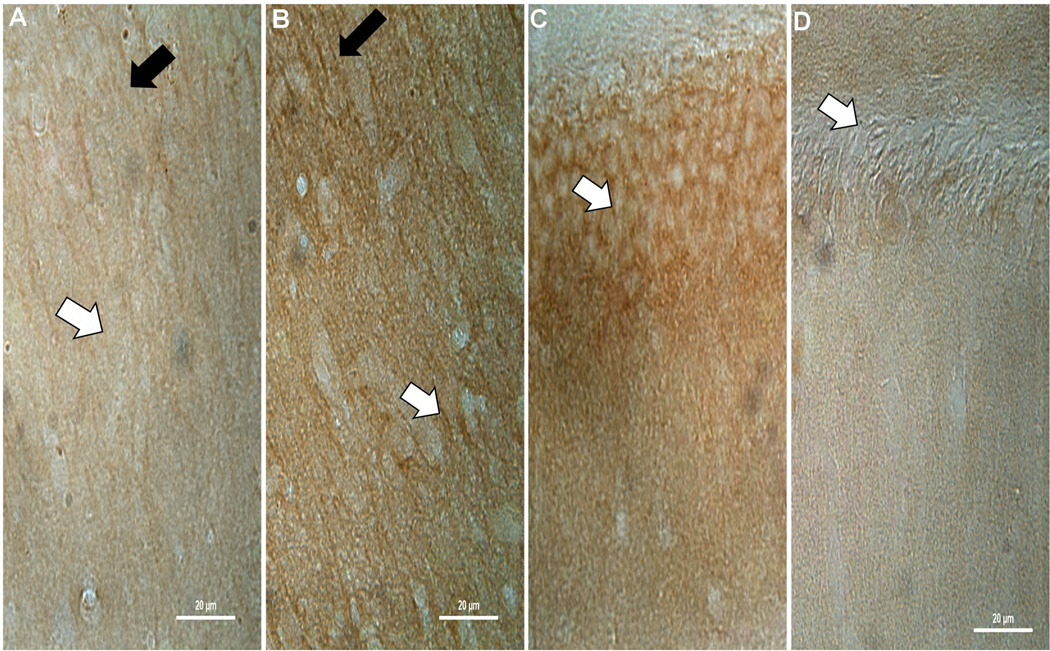
Figure 2.
Representative higher power images demonstrating the increase of CnB1 isoform staining in CA1 of TBI animals (B – white arrow) compared to sham (A – white arrow) at 2 hours post injury, with a relative sparing of dendrites (A and B – black arrows). There is also a noticeable decrease in the exposed blade of the dentate in the SG cell body layer as seen in TBI animals (D – white arrow) compared to sham (C – white arrow). There appears to be some cell loss in the dentate which may explain some of the decreases with both isoforms. Similar results can be seen at 2 weeks for CnB1 and at 2 hours (Figure 6) and 2 weeks post injury for CnB2.

