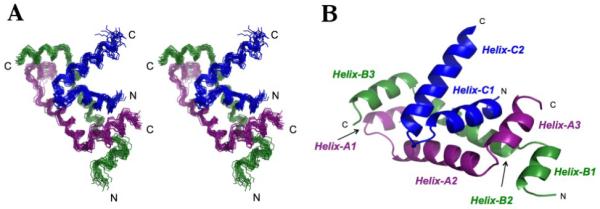
Figure 1.

Overview of the complex between the N-terminal domain of RFX5 and the C-terminal domain of RFXAP (A) Stereo view of best-fit superposition of the backbone heavy atoms for the 20 refined complex structures for RFX5 residues 28-68 and RFXAP residues 225-260. (B) Representative ribbon diagram of the RFX5N2·RFXAPC complex. RFX5N monomer A is colored purple, monomer B colored green, and RFXAPC is colored blue. This figure and subsequent figures were generated using Pymol46.
