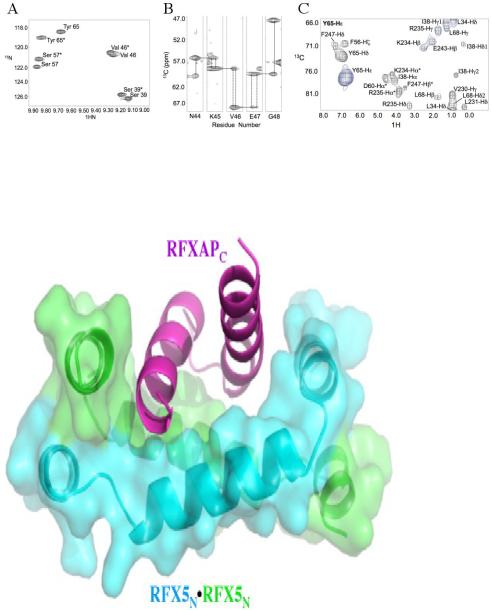
Figure 6.
RFX5 NMR data asymmetry (A) Enlarged section of the HSQC highlighting the observed peak doubling. (B) HNCA strips for a stretch of amino acids showing peak doubling. Dotted lines indicate doubling of signal for the proton chemical shifts. (C) 4D CCNOE plane for Tyr 65 Hε to show overlapping signals that correspond to Tyr 65A and Tyr 65B in one plane. Specifically, Tyr 65A Hε (monomer A) has an NOE to Val 230 and L231 methyl protons (RFXAP helix-C1), and an aromatic-aromatic signal between Tyr 65B and F247 Hε (RFXAP helix-C2). *Indicates spin diffusion peaks.

