
Figure 2.
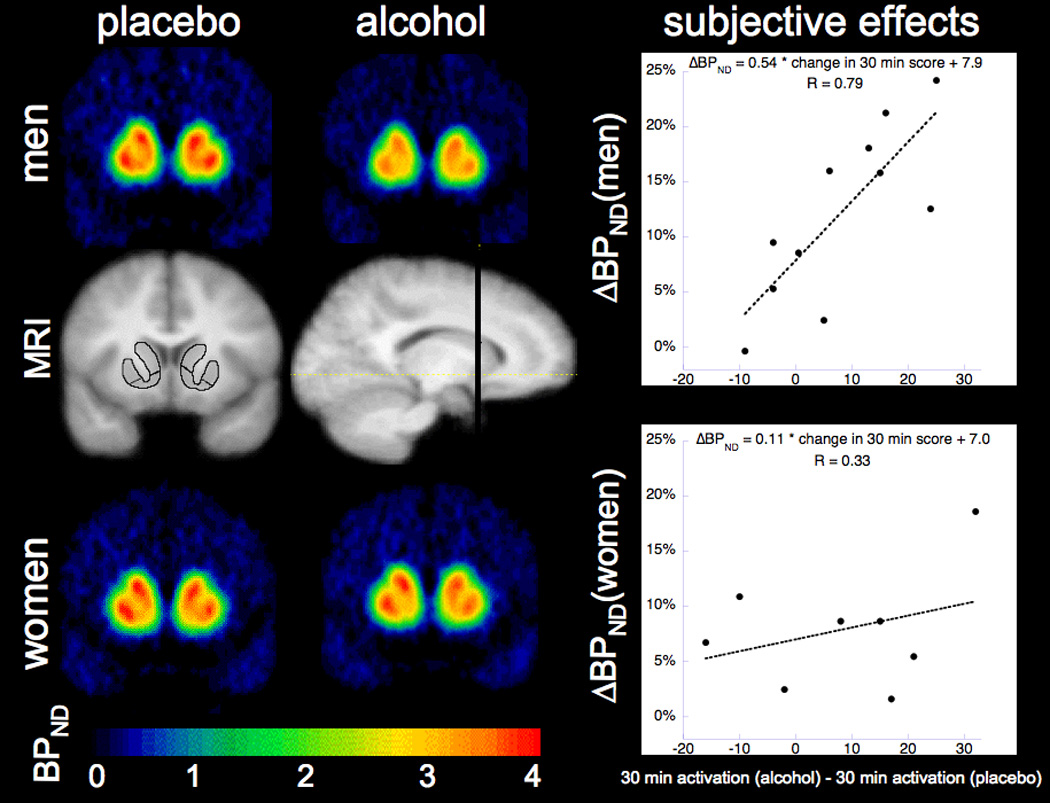
Striatal change in [11C]raclopride binding potential maps and subjective activation in response to alcohol
Binding potential maps averaged across men (n=11, top) and women (n = 10, bottom) following placebo drink (left) and alcohol drink (right). The MRI images (center) are averaged across all 21 subjects. Images were all non-linearly warped into MNI space in the SPM2 software environment (31). The ROIs on the coronal MRI image (left) are the preDCA, preDPU and VST. The line through the sagittal MRI slice (right) shows the coronal slice level of the other images. The graphs on the right show the correlation between subjective activation at 30 minutes after drink (total score post-alcohol minus total score post-placebo, not adjusted for baseline) and absolute ΔBPND. The relationship is stronger for men (top). Note that the absolute value of ΔBPND is presented here.