
Figure 3. Changes in promoter H3K4me3 and H3K27me3 levels are correlated with lncRNA expression.
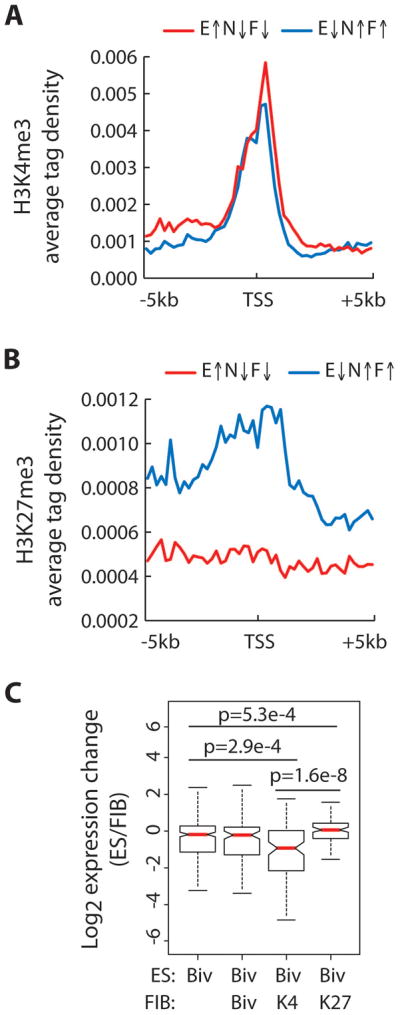
The average H3K4me3 (A) and H3K27me3 (B) tag density across the promoters of lncRNAs in ES cells grouped by relative expression in ES versus NPC and fibroblast. X-axis represents the region spanning −5kb to +5kb away from the lncRNA transcription start site (TSS). Red line indicates lncRNAs that exhibit at least 2-fold higher expression in ES cells relative to both NPCs and fibroblast cells, E↑N↓F↓ (n=1511). Blue line indicates lncRNAs that exhibit at least 2-fold lower expression in ES cells relative to both NPCs and fibroblast cells, E↓N↑F↑ (n=1696). (C) Box plot presentation of expression change (ES/FIB) in bivalent-marked lncRNAs in ES cells (n=321), which are further divided into three groups according to their promoter H3K4 and H3K27 methylation state in fibroblast cells: H3K4me3 and H3K27me3, Biv (n=115); H3K4me3 only, K4 (n=98); H3K27me3 only, K27 (n=89). Significant p values as determined by Wilcoxon signed-rank test are indicated.