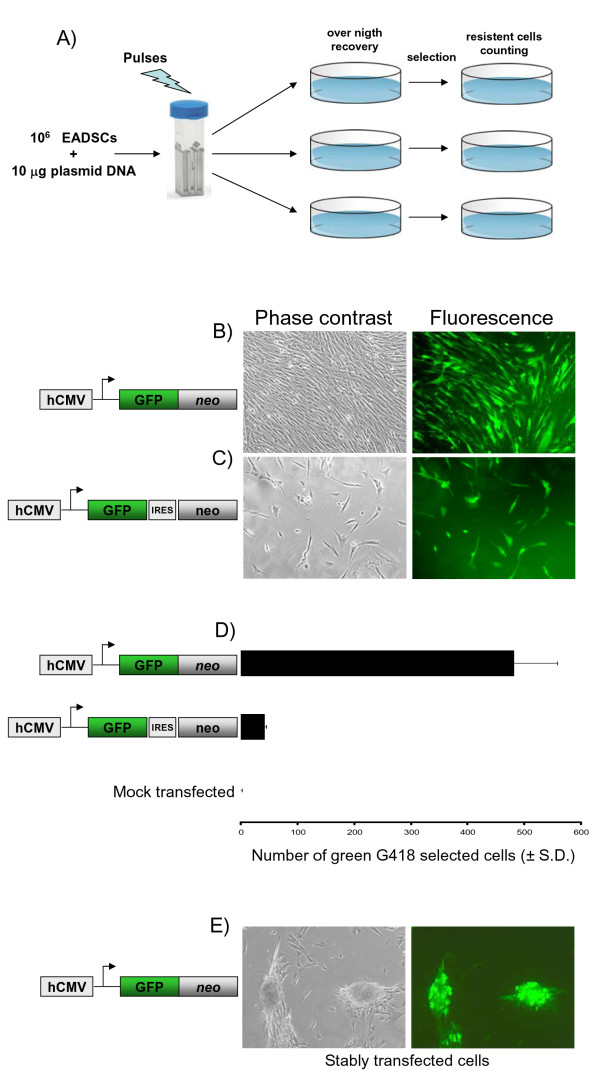
Figure 5.
Generation of stably transfected EADSCs. A) Flow chart of the method used to obtain a homogeneous population of EGFP stably labelled EADSCs by electroporation and drug selection. Phase contrast and fluorescence representative images (20×) of green G418-selected EADSCs generated with pCMV-EGFP/neo fusion peptide (B) and pCMV-EGFP-IRES-neo bicistronic vector (C) (diagram not on scale beside the images). D) Generating efficiency of green G418 selected EADSCs obtained with pCMV-EGFP/neo and pCMV-EGFP-IRES-neo respectively and compared to mock-transfected EADSCs. Each experiment was done in quadruplicate, and each point represents the average ± standard deviation from three experiments. Green G418 EADSCs were monitored by fluorescence microscope and quantified by flow cytometry. E) Phase contrast and fluorescence representative images of differentiated stable green G418 selected EADSCs obtained with pCMV-EGFP/neo.

