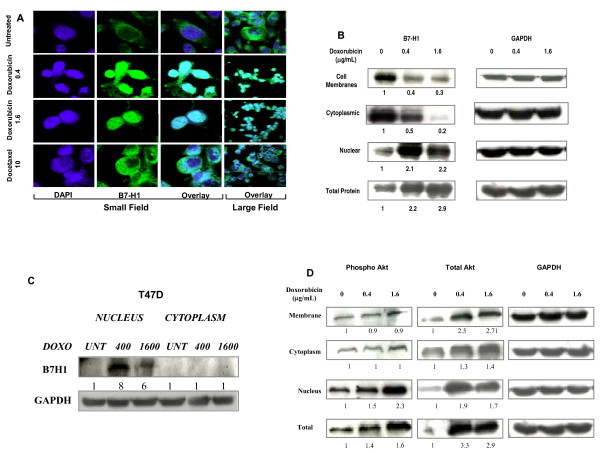
Figure 3.
The effect of doxorubicin on B7-H1 cellular distribution. A) Representative confocal immunofluorescence image of MDA-MB-231 cells monolayer after drug treatments. The overlay of B7-H1 (green) DAPI (nucleus blue) is shown as bluish white color. Numbers beside drugs indicates the concentration in μg/mL. B and D) Western blot showing B7-H1 and phospho-AKT expression respectively in different protein fractions of MDA-MB-231 cells treated with doxorubicin for 72 hours. C) Western blot showing B7-H1 expression in different protein fractions of T47 D cells treated with doxorubicin for 72 hours. GAPDH was used as control as well as for quantification of the B7-H1 expression.

