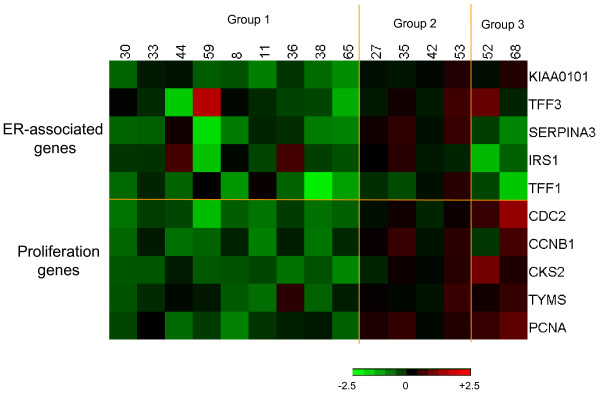
Figure 3.
Heterogeneity of endocrine-resistant tumours. Heatmap illustrates changes after 10 to 14 days of treatment with Letrozole: Green represents a decrease in mRNA expression, red represents an increase in mRNA expression, brightness of colour corresponds to the degree of changes. Scale in log to the base 2.

