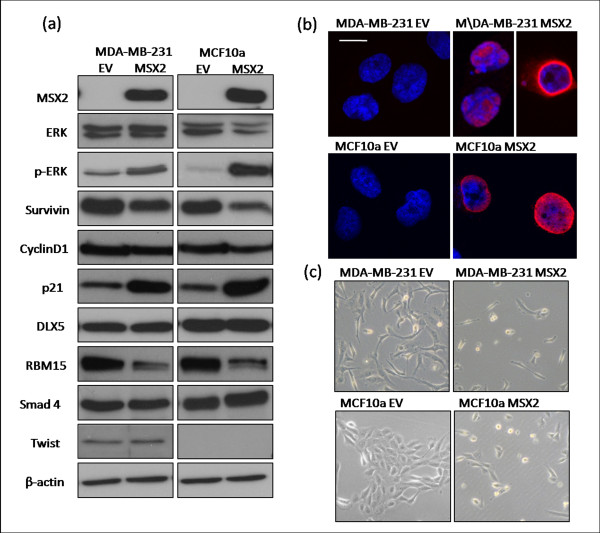
Figure 4.
Characterisation of Msx2-overexpressing breast cell lines. (a) Light microscopic images of MDA-MB-231 and MCF10a cell lines, transduced with EV or Msx2 expression vector, showing increased cell death in Msx2-overexpressing cells. (b) Immunofluorescence microscopy detecting Msx2 localisation in MDA-MB-231 and MCF10a cell lines with ectopic Msx2 expression. Scale bar represents 10 μm. Images are representative of three experiments. (c) Examination of a number of cell cycle and Msx2-interacting proteins by Western blot analysis in empty vector and Msx2-overexpressing MDA-MB-231 and MCF10a cell lines. Images are representative of three replicates.

