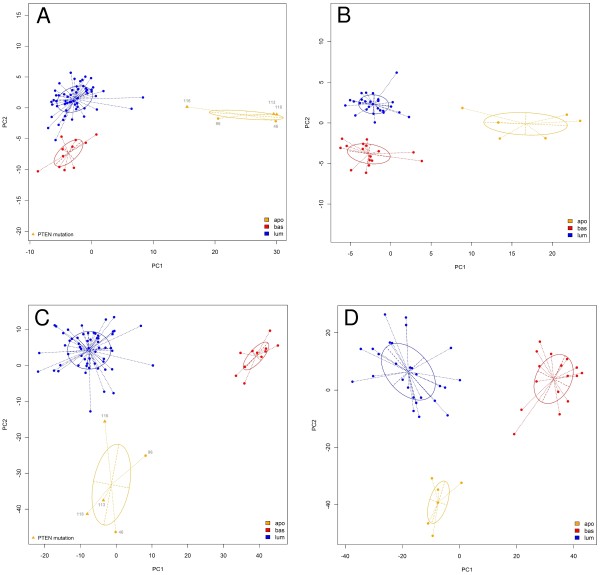
Figure 3.
Principal components analysis using the Cowden and molecular apocrine (Farmer) signatures (13). The first two principal components were used to plot the tumors from this study in A and C, and to plot the tumors from the Farmer study in B and D. The genes used were derived from the Cowden signature in A and B, and from the Farmer signature in C and D. In both cases, the signatures from the two studies identify the same tumors.

