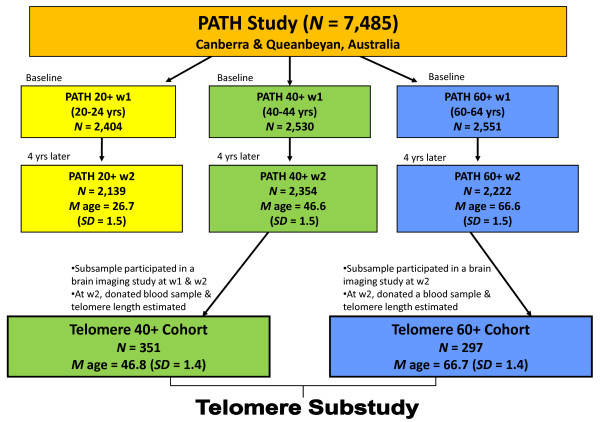
Figure 1.
The relationships between the 40+ and 60+ Telomere Cohorts and the PATH Through Life (PATH) Study. The flow chart shows the recruitment of the 40+ and 60+ Telomere Cohorts from the PATH Study. Telomere length was estimated at Wave 2 and cognitive performance was measured at Waves 1 (w1) and 2 (w2) (except for the Trails B Test, which was measured at w2 only).

