
Fig. 7.
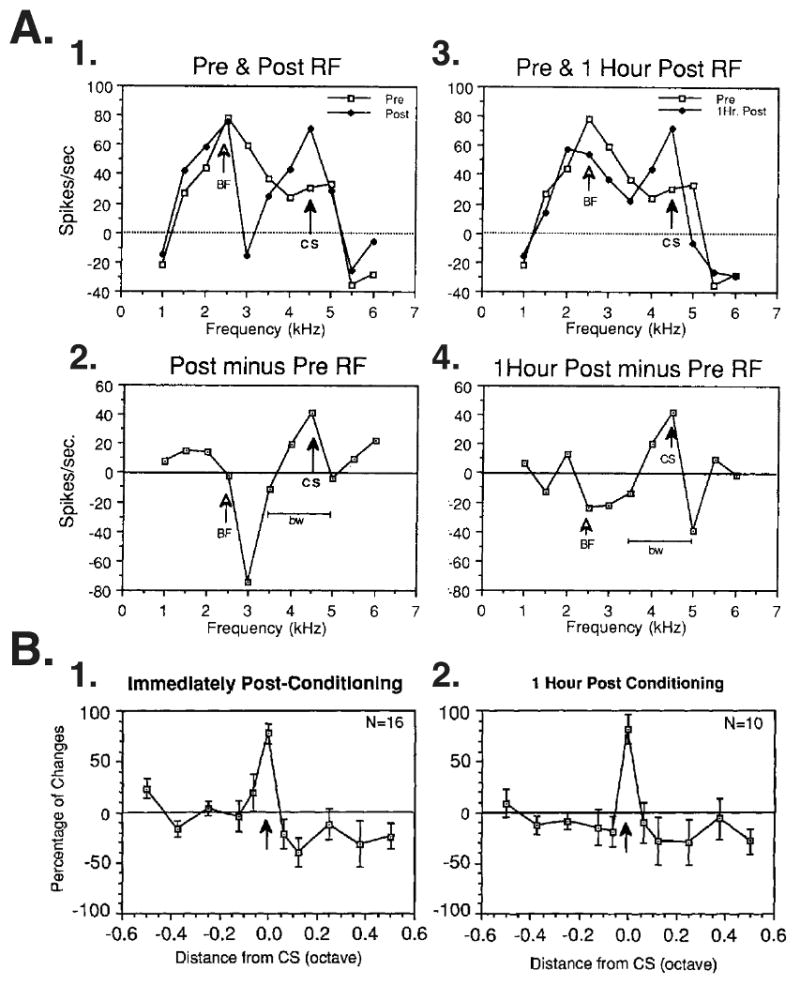
CS-specific receptive field plasticity in the medial division of the medial geniculate body in auditory fear conditioning. Guinea pigs received 30 trials of tone–shock pairing and developed behavior signs of AFC, i.e., conditioned bradycardia to the CS tone. (A) An example of frequency receptive fields before (“Pre”) and both immediately and 1 hour after (“Post”) the single conditioning session. (A1) Before conditioning, the best frequency was 2.5 kHz; the CS was selected to be 4.5 kHz. Immediately post-conditioning, there were increased responses at 4.0 and 4.5 kHz and some lower frequencies. (A2) RF difference function, i.e., the pre RF was subtracted from the post-training RF. Note that the maximum increase is at 4.5 kHz, the CS frequency. There was no change in response of the pre-training best frequency of 2.5 kHz. (A3) Comparable data obtained after a retention period of 1 h, i.e., with no additional training, shows continued development (“neural consolidation”). Compared to the pre-training RF, responses to some non-CS frequencies have declined, producing a shift in tuning so that the CS frequency became the new BF. (A4) The RF difference function shows that the largest increase in response is maintained at the CS frequency. In this case, the bandwidth (bw) of CS-related facilitation of response has been maintained as well. (B) MGm group data shown as normalized mean group RF difference functions for CS-specific plasticity. Graphs show percent change as a function of octave distance from the CS frequency. (B1) Immediately after conditioning (n = 16), the CS frequency showed a marked increase while frequencies as close as 0.1 octaves showed no change or decreased response. (B2) One hour later, the magnitude and specificity of CS-specific RF plasticity were maintained for cells still recorded (n = 10). CS-specific facilitation and CS-directed tuning shifts were never found in sensitization control subjects. (Edeline and Weinberger, 1992)