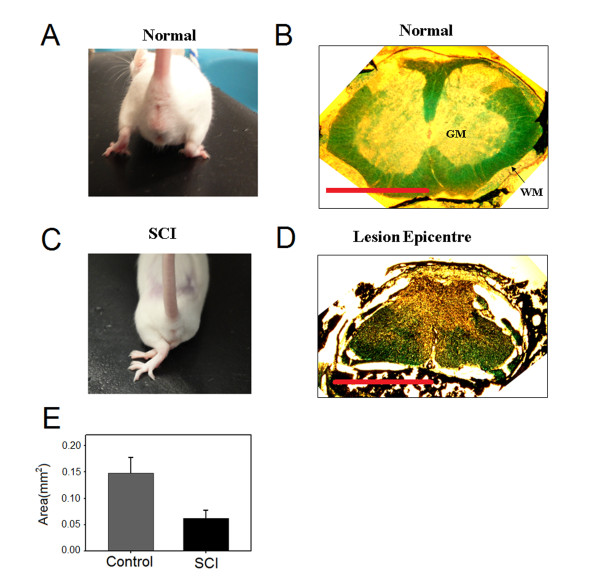
Figure 2.
Anatomical assessment of spinal cord injury. A: a photograph of control animal shows the control posture of the hindlimbs. B: a representative photograph of spinal cord cross-sectional slice taken from the thoracic level of a control animal. WM - white matter, GM - gray matter. C: a photograph of SCI animal shows the abnormal pattern of the hindlimbs. D: a photograph of a representative slice showing the lesion epicenter taken from SCI animal. Scale bars: 1 mm. E: quantification of spared white matter at the lesion epicenter (n = 6) and from control animals (n = 3). Lesion epicenter had significantly less white matter from control (p = 0.04).

