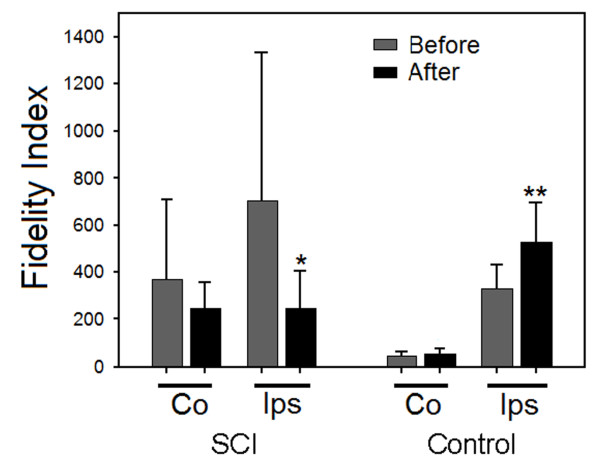
Figure 8.
Fidelity index analysis. Fidelity index (spinal response/muscle twitch force) was quantified from 6 control and 9 with SCI animals. In animals with SCI, Contralateral (CO) to stimulated M1 fidelity index shows reduction after dCMS but was not statistically significant; however, ipsilateral (Ips) fidelity index was significantly reduced after dCMS. In control animals, after dCMS, Fidelity index was increased contralateral to stimulated M1 but was not statistically significant, however, the ipsilateral Fidelity index was significantly higher after dCMS. Note that the lower the fidelity indexes the better the correlation between muscle contraction and spinal response. *p < 0.05, lower from before dCMS; **p < 0.05, higher from before dCMS. Data show means ± SD.

