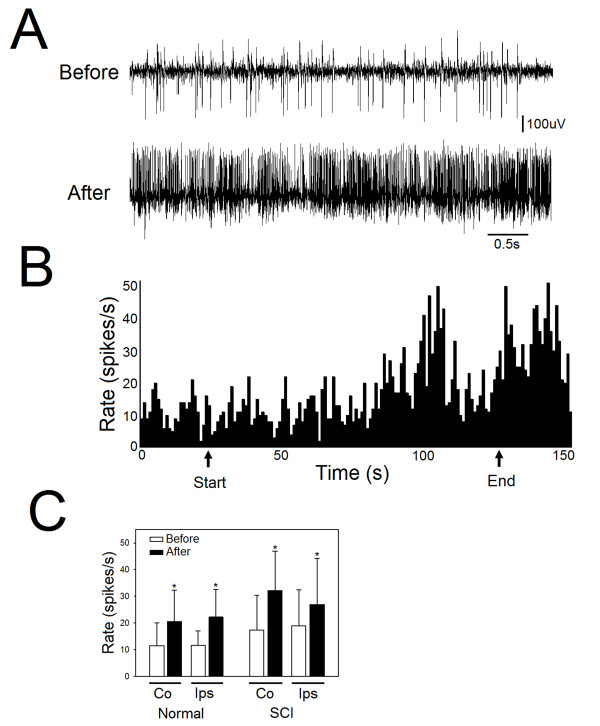
Figure 9.
dCMS increased spontaneous activity of spinal motoneurons (MNs). A: an example of spontaneous activity from one MN shows the level of activity before (upper panel) and after (lower panel) dCMS intervention. This example was taken from SCI animal. B: a representative experiment shows firing rate (spikes/s) during an entire experiment. Arrows show the start and end of dCMS application. C: quantification of spontaneous activity before compared with after dCMS show significant increase in both contralateral (Co) and ipsilateral (Ips) spinal recordings from control and with SCI animals. *p < 0.05. Data show means ± SD.

