
Figure 2.
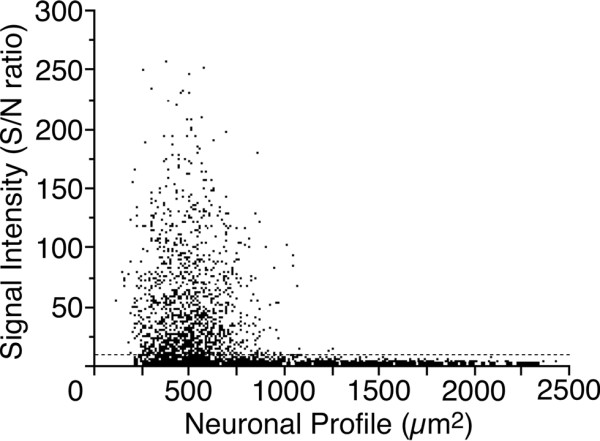
Scatterplot diagram of the DRG neurons expressed mRNA for CysLT2. Individual cell profiles are plotted according to the cross-sectional area and signal intensity (n = 4, 2819 cells). The dashed line indicates the borderline between the negatively and positively labeled neurons (S/N ratio = 20).