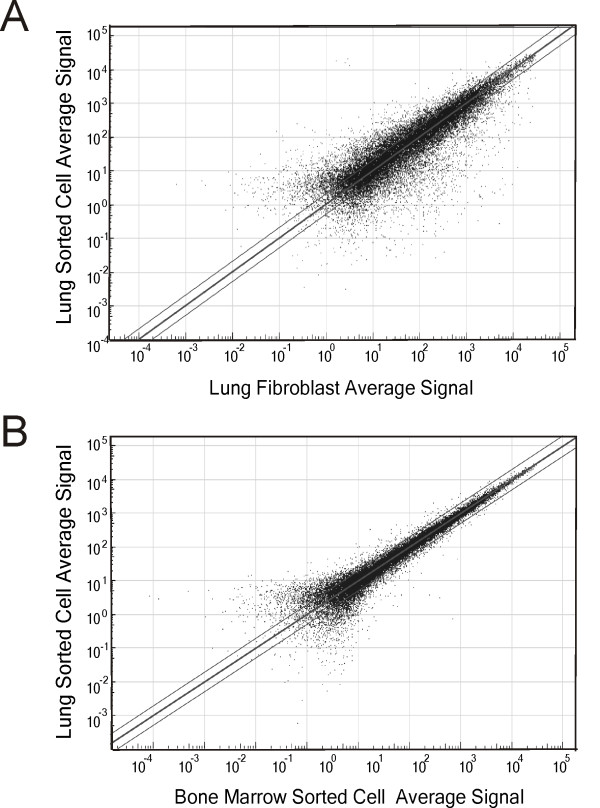
Figure 7.
Concordance of gene probe detection p-values between sorted lung multipotent stromal cells, lung fibroblasts (A) and bone marrow sorted cells (B). Parallel lines signify 1.5 fold change based on average probe signal. There was not a high degree of concordance between lung MSCs and lung fibroblasts, suggesting that lung multipotent stromal cells represent a unique population of cells in the lung.

