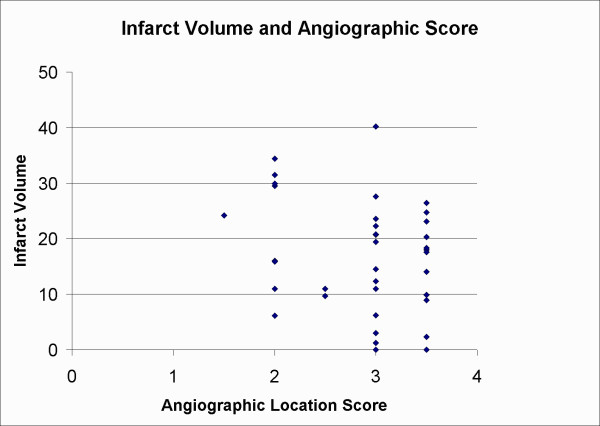
Figure 4.
An illustration of the relationship between infarct volume in percent of a normal hemisphere and angiographic score. No significant differences were observed, thus different embolization sites resulted in similar infarct volumes (especially grade 2 did not differ from grade 3 or grade 3.5). In this study scoring occlusions between two sites by adding or subtracting a value of 0.5 did angiographic occlusion scores more elaborately. Only animals with occlusion grades from 1.5 (distal MCAO) to 3.5 (ICA occlusion at the origin of the MCA after and proximal to the entrance of the posterior cerebral artery) were included.

