
Figure 3.
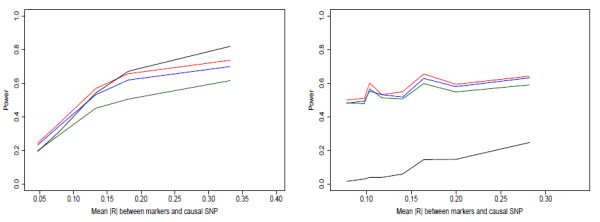
a, b - Power curves from simulation study, MAF = 0.25. Power of main-effects (red), main+adj (blue), haplotype (green), and single-SNP tests (black) for (a) causal allele on moderate number of marker haplotypes; (b) causal allele on one marker haplotype; with causal SNP MAF = 0.25.