
Figure 5.
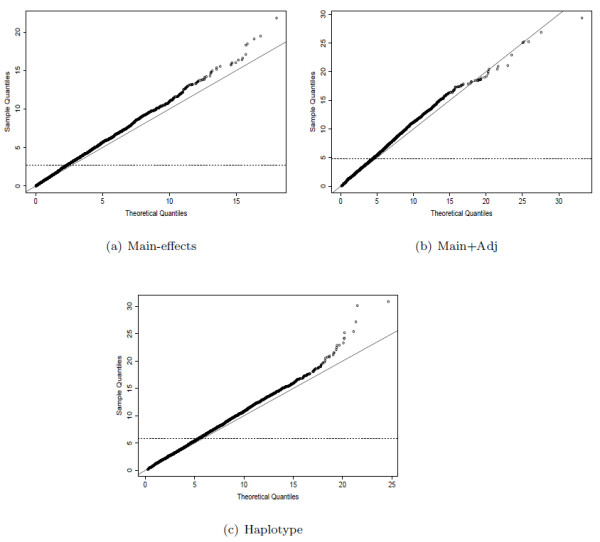
QQ-plots from different models under population stratification. QQ-plots showing distribution of statistics from each model compared to the theoretical null distribution for δ = 0.08, μ = 0.08.
Official websites use .gov
A
.gov website belongs to an official
government organization in the United States.
Secure .gov websites use HTTPS
A lock (
) or https:// means you've safely
connected to the .gov website. Share sensitive
information only on official, secure websites.
QQ-plots from different models under population stratification. QQ-plots showing distribution of statistics from each model compared to the theoretical null distribution for δ = 0.08, μ = 0.08.