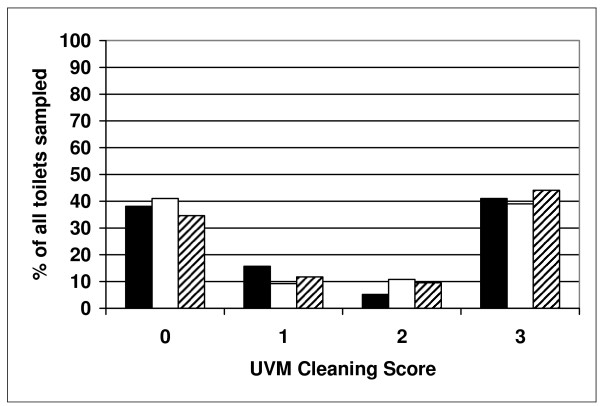
Figure 4.
Overall UVM audit to assess the cleaning efficacy in each arm of the study. The data represents the overall average percent of samples in each Arm showing 0, 1, 2 or 3 as the UVM cleaning score. This is based on data from the first 5 days of samples for each patient in each Arm. This represents 133 samples from 50 patients in Arm 1 (solid bars), 254 samples from 68 patients in Arm 2 (white bars) and 179 samples from 68 patients in Arm 3 (hatched bars).

