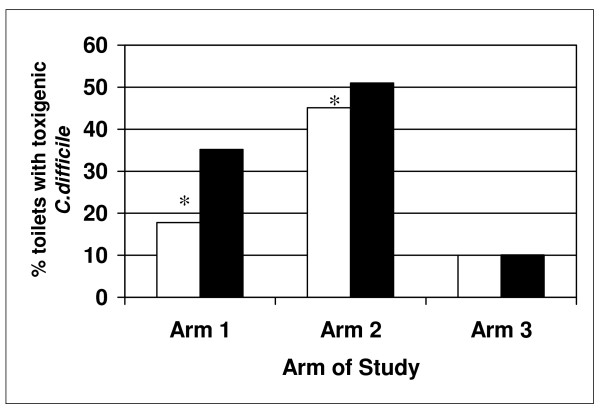
Figure 5.
Effect of cleaning protocol on C. difficile detection in toilets. Data for toilets where UVM was 3 (no cleaning) was compared to toilets that received some cleaning (UVM of 0, 1, 2). See Materials and Methods and Figure 1 for differences in patient population and cleaning protocols used for Arms 1 to 3. Arm 1 had 50 patients enrolled and a total of 133 samples (79 samples with UVM <3 and 50 samples with UVM = 3), Arm 2 had 68 patients and 254 samples (153 samples with UVM <3 and 101 samples with UVM = 3) and Arm 3 had 68 patients enrolled with 179 samples (100 samples with UVM <3 and 79 with UVM = 3. Arm 1 showed significantly lower detection of toxigenic C. difficile detected compared to Arm 2* (p = 0.0023, CI of 0.4589 to 0.8482). The white bars represent results for samples with a UVM <3 (some cleaning) and the solid bars represent results from samples with a UVM = 3 (no cleaning).

