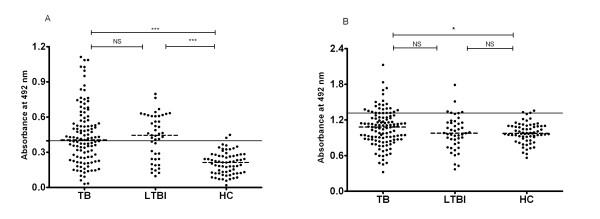
Figure 4.
Comparison of antibody IgG (4-A) and IgM (4-B) responses to recombinant protein Rv1985c among different categories of TB patients, LTBI and HC. Dotted lines on each group indicate the median value. Horizontal lines on each graph indicate the cut-off value, which was determined by the mean absorbance plus 2 SD by use of healthy control sera. P-values of absorbance difference between either two groups were shown above the plots determined by one-way ANOVA Newman-Keuls test. ***, P < 0.001; **, P < 0.01; *, P < 0.05; NS: P-value is not significant.

