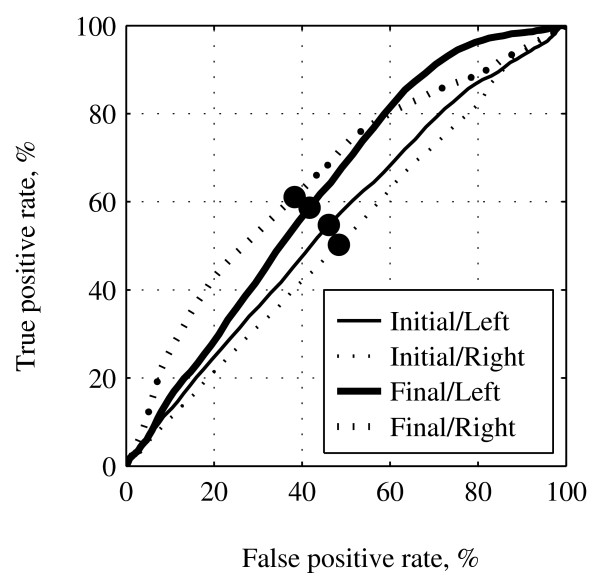
Figure 2.
Receiver operating characteristic (ROC) curve for left- and right-hand MI detection in the initial and final training sessions. The thin curves are the data in the initial training sessions and the thick curves are the data in the final training sessions for the left- (solid line) and right-hand MI (dotted line). The circled points on the curves mark the point of equal balance of sensitivity and selectivity.

