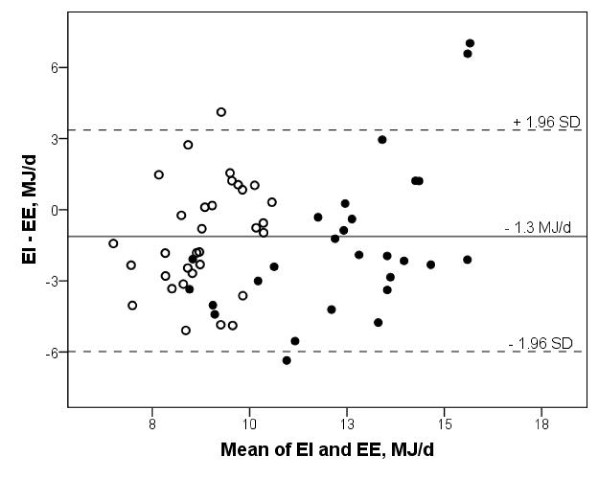
Figure 1.
Energy intake and expenditure in men and women. Bland-Altman plot of the difference between energy intake (EI) and energy expenditure (EE) against the mean of EI and EE for each participant, men (●) and women (○). The differences in EI - EE are normally distributed. The solid line represents the average difference between EI and EE. The dotted lines are upper and lower limits of agreement (mean ± 1.96 SD) in this population.

