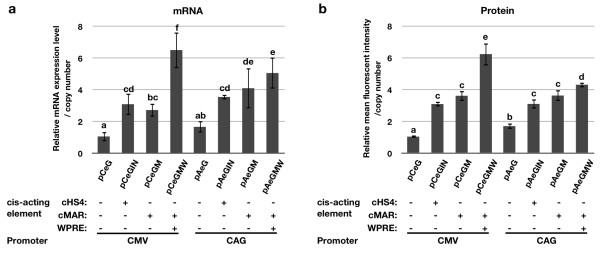
Figure 3.
Analysis of eGFP expression driven by CMV or CAG promoter in DF-1 cells. The effect of various cis-acting elements on eGFP expression were analyzed in both mRNA (a) and protein (b) levels. A significant model effect was found on both mRNA and MFI (both P < 0.0001). Means with different superscripts (a, b, c, d, e, f) differ significantly (P < 0.05; F values = 15.80 and 67.51 in mRNA and protein level analysis, respectively; total degree of freedom = 23). Data represent the mean of three replicates, and error bars indicate ± S.D. (n = 3 in each plasmid).

