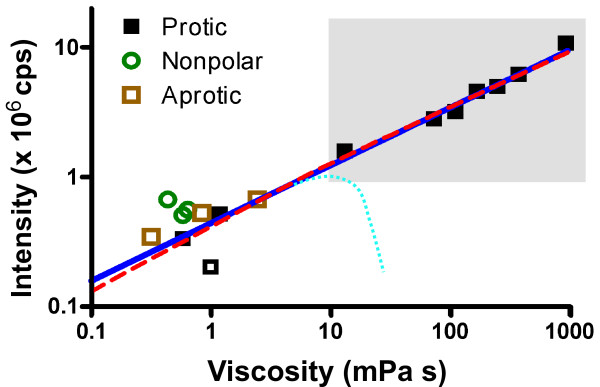
Figure 3.
Comparison of the models for the quantum yield - viscosity relationship. Shown is the peak emission intensity of 5 μM DCVJ in various solvents. Black squares indicate polar, protic solvents (single- and polyfunctional alcohols); green circles indicate dipolar, aprotic solvents, and brown squares indicate nonpolar solvents. Equations 1 and 20 have been fitted to the intensity/viscosity data of the polar solvents (black squares) with the exception of water (open square). The gray region indicates a viscosity gradient made of mixtures of ethylene glycol and glycerol. Equation 1 creates a straight line (blue) in the double-logarithmic plot with a slope of x = 0.45, whereas Equation 20 (red) curves and drops below Equation 1 for large and small η. It can be seen that polarity effects dominate at low viscosities. The light-blue dotted line indicates qualitatively a deviation reported by Law [15] in long-chained 1-alkanols.

