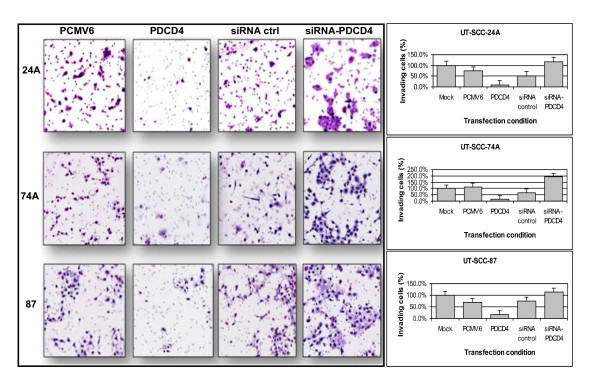
Figure 6.
Representation of invasion (5× magnification, left panel) following over-expression or knock-down of PDCD4 using PDCD4 plasmid or PDCD4 targeted si-RNA, respectively, versus control (PCMV6 and siRNA ctrl) in the UT-SCC cell lines 24A, 74A, and 87. Cells were stained with the Diff-quick stain set. The percentage of invading cells (right panel) is shown for each cell line. Post-transfection, we observed a significantly decrease in the average percentage of invading cells, from 75% to 10% in UT-SCC-24A, from 113% to 17% in UT-SCC-74A, and from 69% to 16% in UT-SCC-87. Knock-down of PDCD4 resulted in an increase in the number of invading cells, from 52% to 118% in UT-SCC-24A, from 67% to 193% in UT-SCC-74A, and from 76% to 113% in UT-SCC-87.

