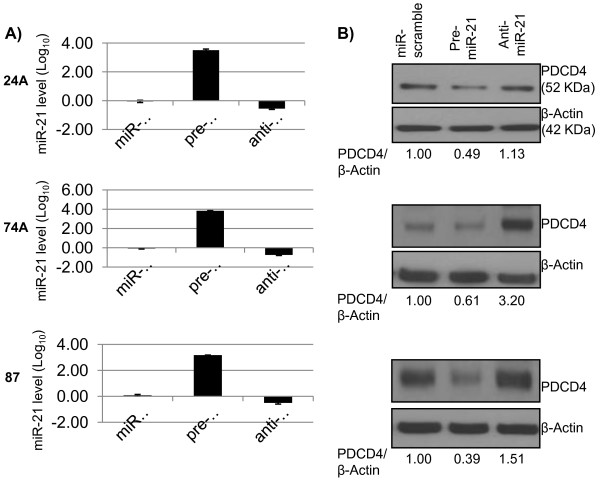
Figure 7.
Panel A shows miR-21 expression in pre-miR-21 or anti-miR-21 transfected cells compared to control (miR-scramble) in the UT-SCC cell lines 24A, 74A, and 87. Panel B shows PDCD4 protein levels (Western blot) after transfection with pre-miR-21 or anti-miR-21 compared to miR-scramble control. PCR data plotted are the mean ± SE and are representative of 3 separate experiments. In the Western blot, PDCD4/β-Actin represents the ratio of the band intensity of PDCD4 compared to that of β-Actin, and are shown below the blots, for each cell line. Panels A-C in the same line corresponds to the same cell line, in this order (UT-SCC-24A, 74A and 87).

