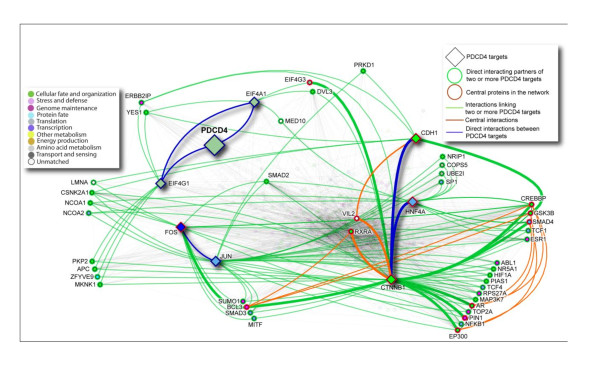
Figure 9.
Protein-protein interaction network of PDCD4 targets. I2D version 1.72 was used to identify direct protein interactions for the PDCD4 targets (highlighted as diamond-shape nodes; n = 8). The resulting network of 523 proteins and 3,941 interactions was visualized using NAViGaTOR 2.1.14 http://ophid.utoronto.ca/navigator. Color of nodes corresponds to Gene Ontology biological function; shape of nodes represents different types of important proteins; color of edges represents different interactions among targets, as described in the legend. Blue edges signify direct interactions among PDCD4 targets. Green-highlighted nodes represent proteins interacting with at least two PDCD4 targets, and green edges identify corresponding interactions with PDCD4 targets. Red-highlighted nodes represent central proteins, and thick edges represent central interactions, and orange edges show direct interactions among central proteins and PDCD4 targets. Remaining nodes and edges were faded out to reduce network complexity. Network representation in XML file for NAViGaTOR, and annotation table, are provided in supplementary material.

