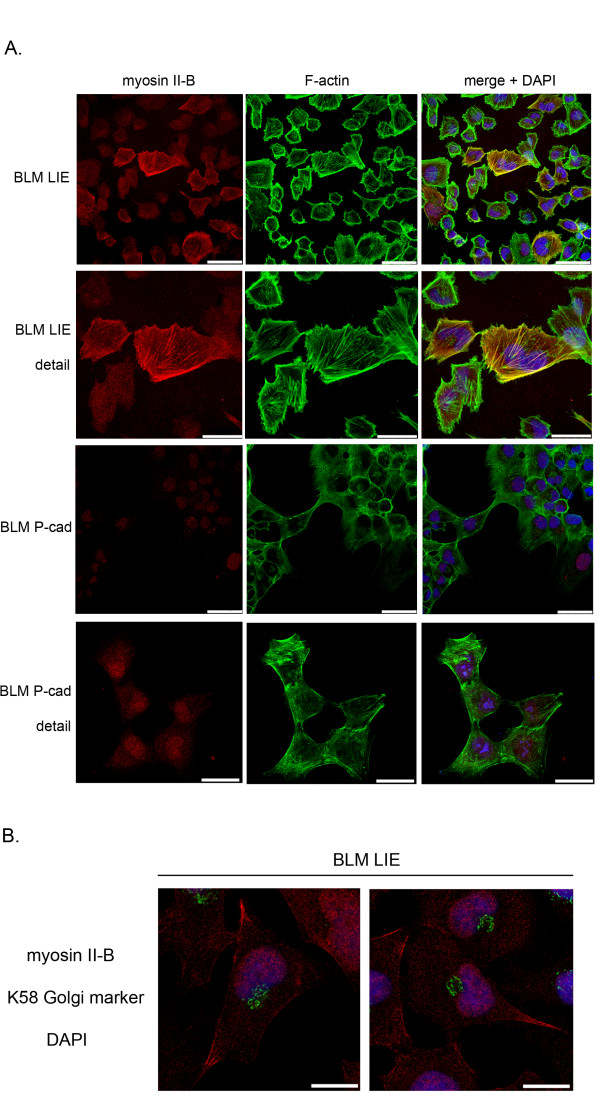
Figure 2.
Confocal images of myosin II-B in BLM LIE and BLM P-cad. (A) Myosin II-B (red) confocal images with the F-actin cytoskeleton (green) and merge with DAPI (blue) nuclear staining. The detailed images show the formation of myosin II-B stress fibers and colocalization with F-actin, as indicated in the merge by yellow coloured stress fibers, in BLM LIE. Note the weak and diffuse myosin II-B staining pattern in BLM P-cad (scale bar = 50 μm, for detail image scale bar = 25 μm). (B) Immunofluorescence double staining of myosin II-B (red) and K58 Golgi protein (green). Position of Golgi and myosin II-B relative to nucleus (blue) reveals the function of myosin II-B occurring at the trailing end (scale bar = 25 μm).

