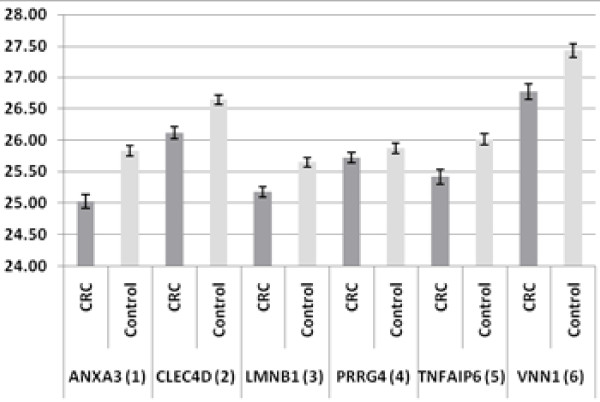
Figure 1.
Comparison of the Expression of Six Genes of Interest (ANXA2, CLEC4D, LMNB1, PRRG4, TNFAIP6 and VNN1) in CRC (N = 99) and Controls (N = 101) as shown in Raw Ct-values. (Error bars denote Standard Errors of the Mean) All six biomarkers are shown as up-regulated genes in CRC as compared with controls.

