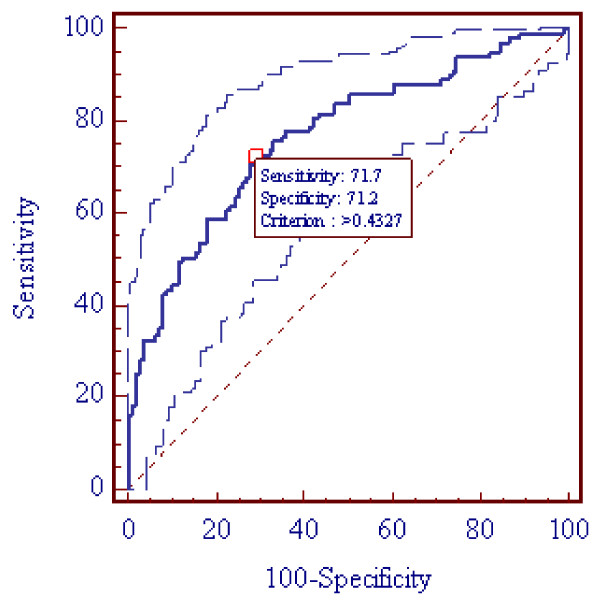
Figure 3.
Area Under the Curve (AUC) of the Receiver Operating Characteristic Curve (ROC) Analysis with 95% Confidence Limits (AUC = 0.76 and CI: 0.70 - 0.82) and at the Optimized Thresholds (P = 0.4327) for Sensitivity and Specificity. Note: The MedCalc software, version 11.3 (Broekstraat 52, Mariakerke, Belgium) was used for the statistical analysis. CI denotes confidence interval.

