Figure 2.

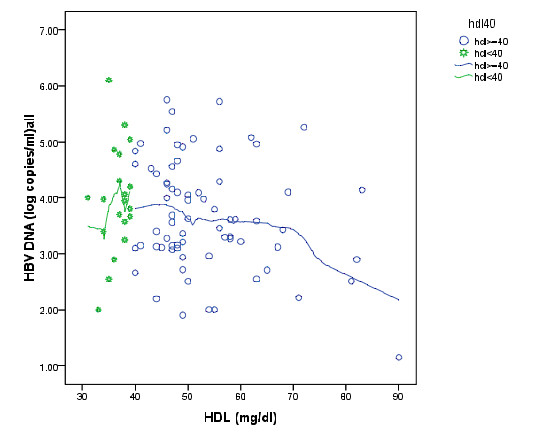
Scatter plot of HDL (mg/dl) and HBV DNA (log copies/ml) with Epanechnikov kernel smoothing line in HDL less than 40 (star mark) and HDL more than 40 (cycle marks).

Scatter plot of HDL (mg/dl) and HBV DNA (log copies/ml) with Epanechnikov kernel smoothing line in HDL less than 40 (star mark) and HDL more than 40 (cycle marks).