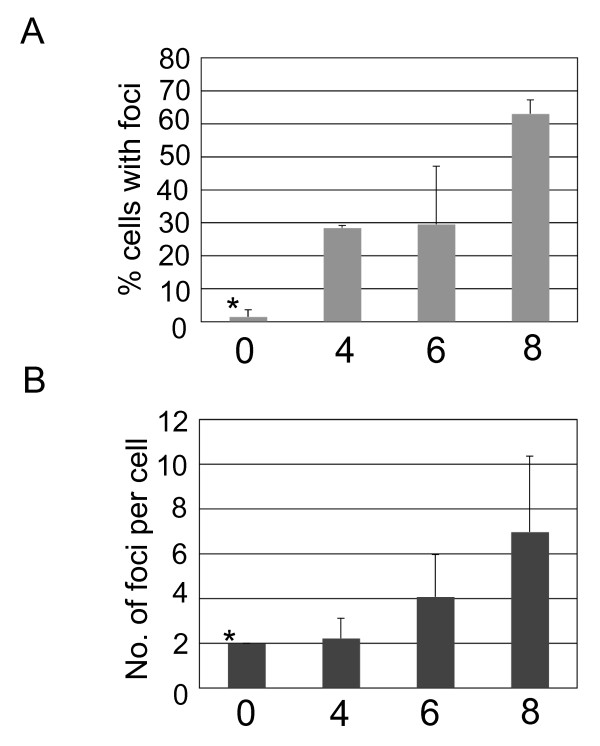
Figure 3.
Quantitative analysis of HDAC4 foci in the vector-infected cells. Number of HeLa cells containing foci, as well as foci number per cells were counted in images prepared as described in Fig. 2 and "Experimental Procedures". (A) Number of foci-containing cells. (B) Average number of foci among foci-containing cells. Numbers (x axis) indicate hours post-infection. Bars indicate standard deviation. * - only one foci-containing cell was found.

