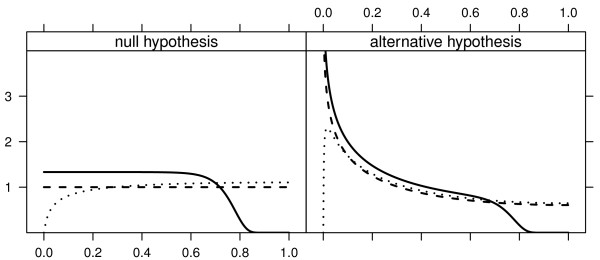
Figure 1.
Probability density functions (pdf) of p-values for two filters under the null hypothesis (tv = 8 (δ = 0)) (left panel) or alternative hypothesis (tv = 8 (δ = 1)) (right panel). For each filter 25% of the hypotheses are removed. The fold-change filter is shown as a solid line, the variance filter as a dashed line, and the pdf with no filtering is shown as a dashed line. For more details on how these were obtained see section "Filtering and p-values distribution" of Additional File 1.

