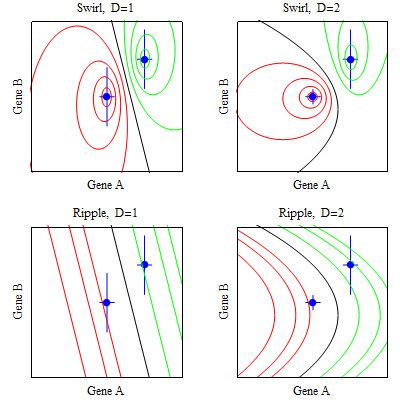
Figure 1.

Illustrative classification boundaries for two genes. The points are the centroids. Vertical and horizontal lines at the centroid are proportional to the variances. Distance measures are D = 1 = pooled variance and D = 2 = class-specific variance.
