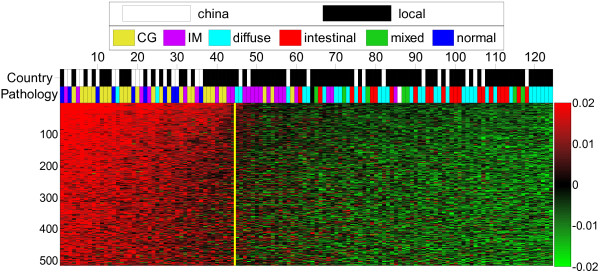
Figure 1.
Heat map of super-bicluster 7. Heat map for the prototype of the most prominent super-bicluster, SBC7, generated by the BOA algorithm for the gastric cancer data. The vertical axis shows the 515 most significant genes ordered by f(g) in Algorithm 1, and cut by θG = 5.0, while the horizontal axis shows all samples ordered by h(s) and cut by θS = 4.5. The yellow vertical line in the middle of figure indicates the boundary between the samples in the bicluster (left-side) and others (right-side). The bicluster samples are enriched with the CG subtype with a p-value of 4.32 × 10⁻¹⁰ in terms of the SCS metric or enriched with a combination of {normal, CG, IM} subtypes with a p-value of 4.03 × 10⁻¹⁴ in terms of the MCS metric. Moreover, we observe a strong gradation from least malignant samples (normal and CG), through an intermediate phenotype IM, to the malignant samples (combined intestinal, diffuse and mixed gastric cancers). Two phenotypes, squamous and adenosquamous, with only one sample are annotated with black and white, respectively, but are not shown on the legend. The probability of obtaining such or better ordering by random chance was estimated to have a p-value of 5.35 × 10⁻²² in terms of Jonckheere's test.

