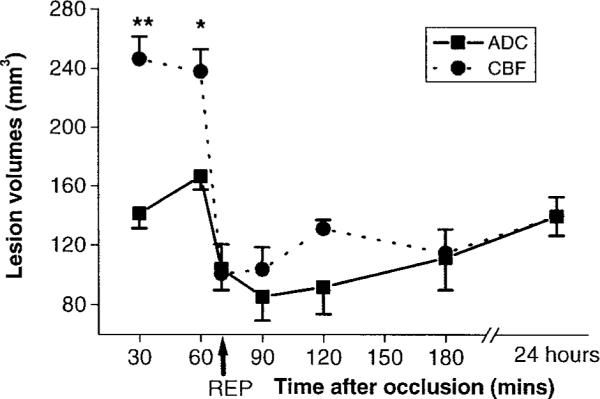
Fig 2.

Temporal evolution of apparent diffusion coefficient (ADC)– and cerebral blood flow (CBF)–derived ischemic lesion volumes (mm3) in Group 3 (n = 6) subjected to 60 minutes of suture MCAO based on ADC and CBF reduction thresholds of 30 ± 2% and 57 ± 11%, respectively. The ADC- and CBF-derived lesion volumes are compared with the 2,3,4-triphenyltetrazolium chloride–derived infarct volume at 24 hours. The error bars are standard error of the mean. Arrow indicates reperfusion (REP). *p < 0.005; **p <0.001.
