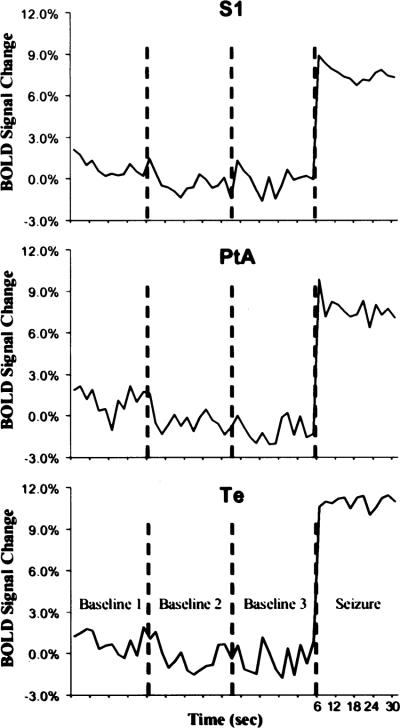
FIG. 5.
Change in blood-oxygen-level–dependent (BOLD) signal intensity over time for each region of interest (ROI) in the cortex. All cortical ROIs showed significant BOLD signal changes from baseline. All ROIs are bilateral structures, so the signal intensities from each hemisphere were combined. These plots were created by averaging the value for all seizures at each time point. Each image acquisition was 2 s. BOLD signal changes are shown for each baseline period, collected at different points throughout the imaging session. PtA, parietal association cortex; S1, sensory cortex; Te, temporal cortex.

