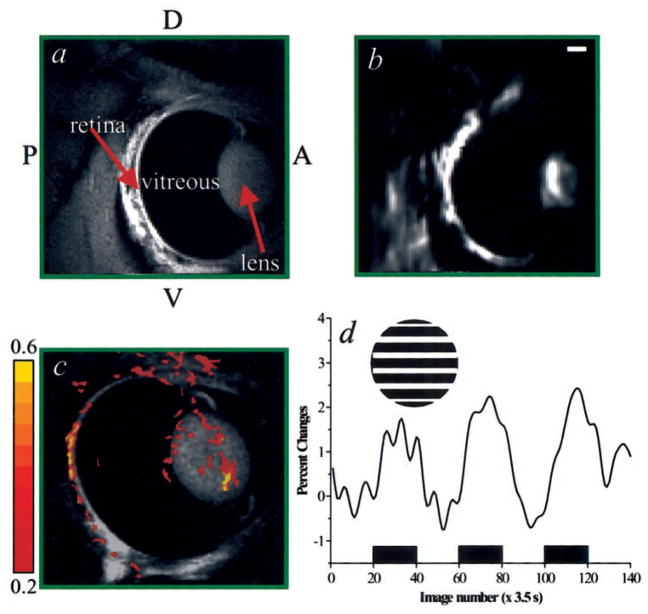
Figure 1.
Anatomic (a) and corresponding echo-planar (b) images, at 234 × 234 × 1000 μm3 and 468 × 468 × 1000 μm3, respectively. The cornea, lens, vitreous humor, and retina are clearly depicted in the anatomic image. (c) First attempt to obtain an fMRI of the retina under drifting versus dark stimulation without systemic paralytics and topical anesthetics. The cross-correlation activation map (468 × 468 × 2000 μm3) of the retina is overlaid on an anatomic image. The color pixels reflect cross-correlation coefficients, as indicated by the color bar. Functional responses from the retina are clearly depicted, with increased activity along the retinal tissue. Artifacts associated with lens movement and saccadic motion outside the retina are also evident. (d) fMRI time course associated with a three-epoch stimulation (indicated by the black boxes) paradigm obtained from active pixels in the retina. The percentage change ranges from 1.5% to 2.0%. Inset: grating stimulus of one orientation (0°). The stimulus was actually drifting. P, posterior; A, anterior; D, dorsal; V, ventral. Scale bar, 2 mm.

