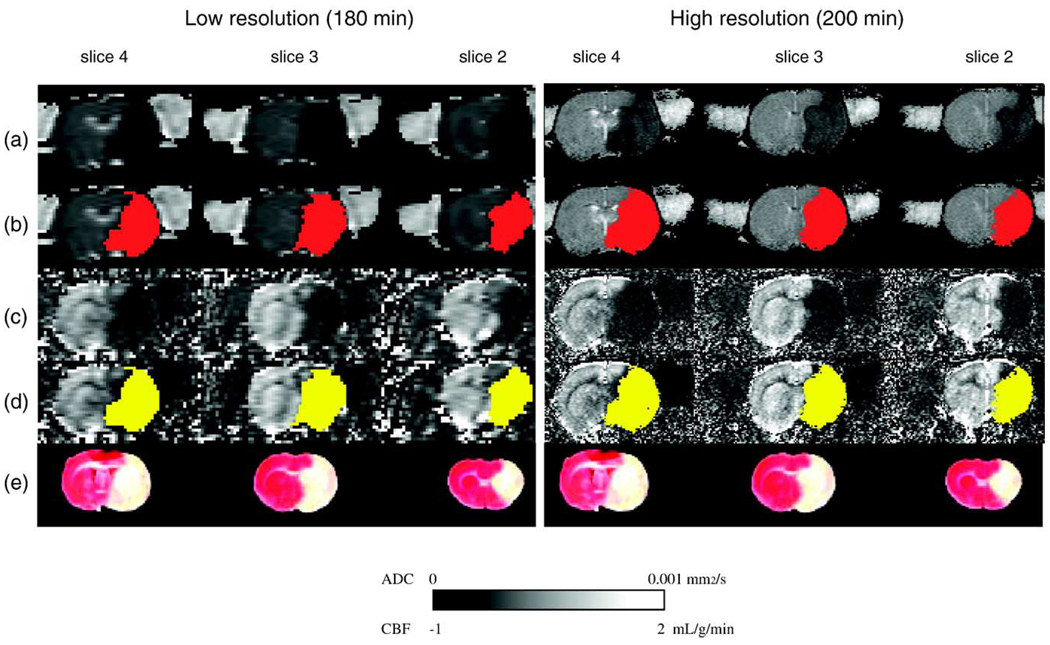
Fig. 2.
Representative ADC (a) and CBF (c) maps from one animal (group L-R). Three of eight multislice maps are shown at 180 (low-resolution) and 200 min (high-resolution) after MCAO. The ADC-derived (b, red) and CBF-derived (d, yellow) lesion volumes determined by high- and low-resolution are almost identical when using viability thresholds and matched well with the TTC-defined infarct volume (e).

