
Figure 1.
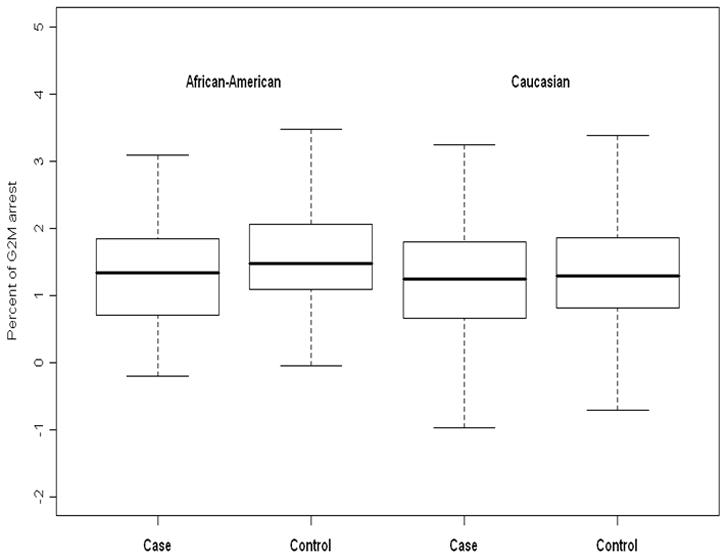
Box and whiskers plots to compare the distribution of percent of G2/M arrest between cases and controls, stratifying by race. In African-Americans, the mean percent of G2/M arrest is significantly higher in controls than in cases (p = 0.02). In Caucasians, there is no significant difference in the mean percent of G2/M arrest between cases and controls (p = 0.47).